1. The Transaction History of a stock item can be reached from the Stock Item Profile.
This information can also be accessed from the Stock History page in the main menu.
TIP! SHORTCUT: Type the stock item name into the global search, located at the top right of each page. This will bypass steps 2-4.
2. Navigate to the main menu. Click "Stock"
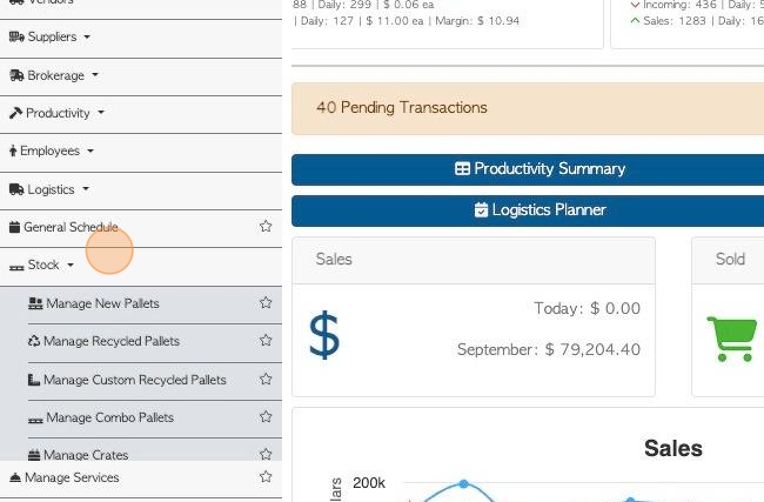
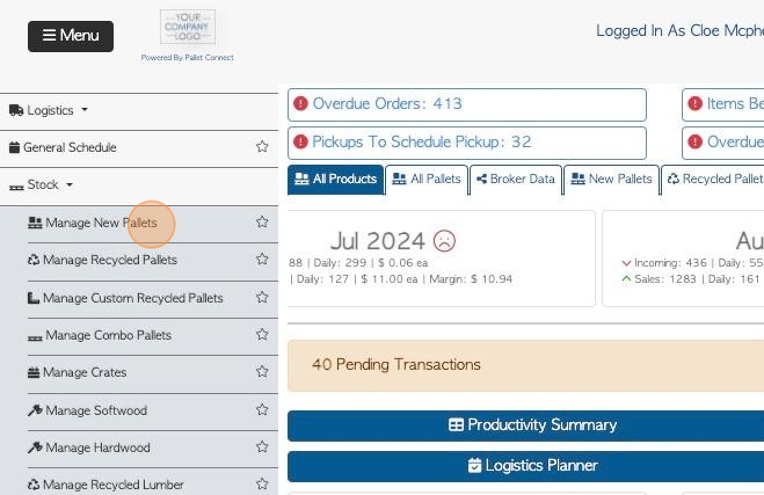
3. Click the relevant stock category e.g. "Manage New Pallets".
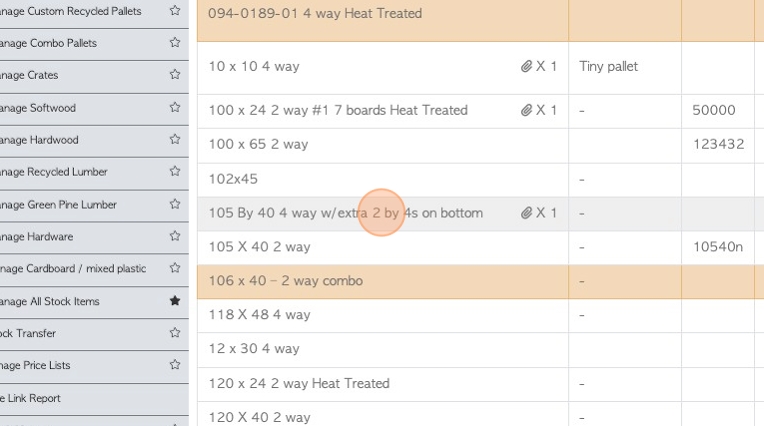
4. Click on the selected stock item from the list.
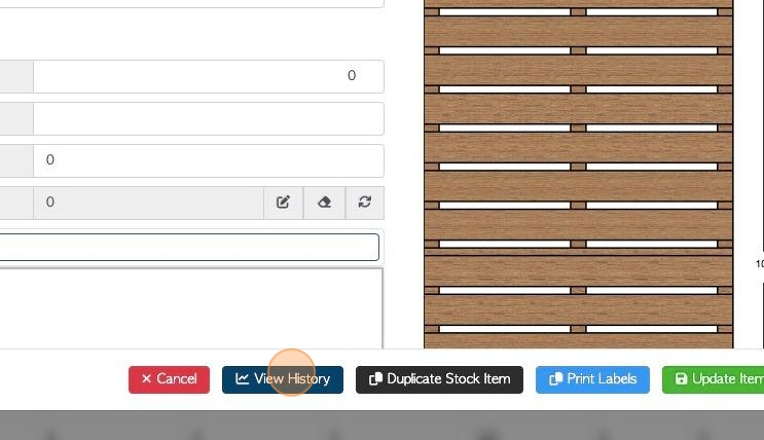
5. From the Stock Item profile, click "View History"
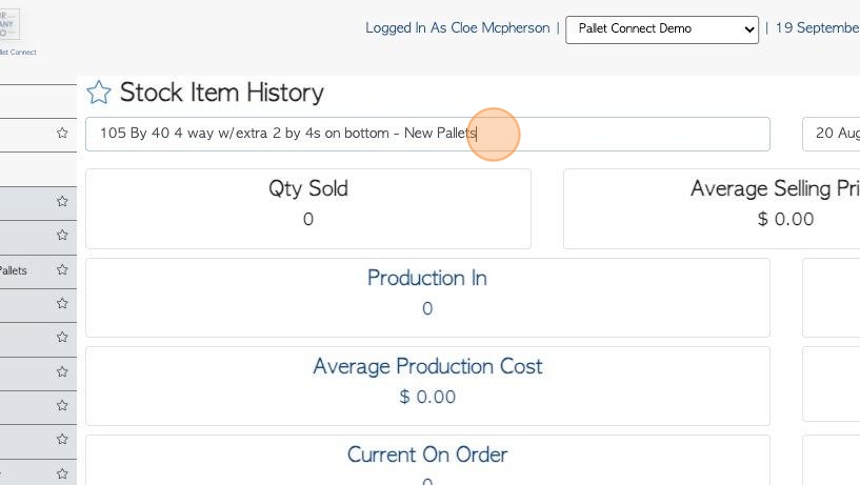
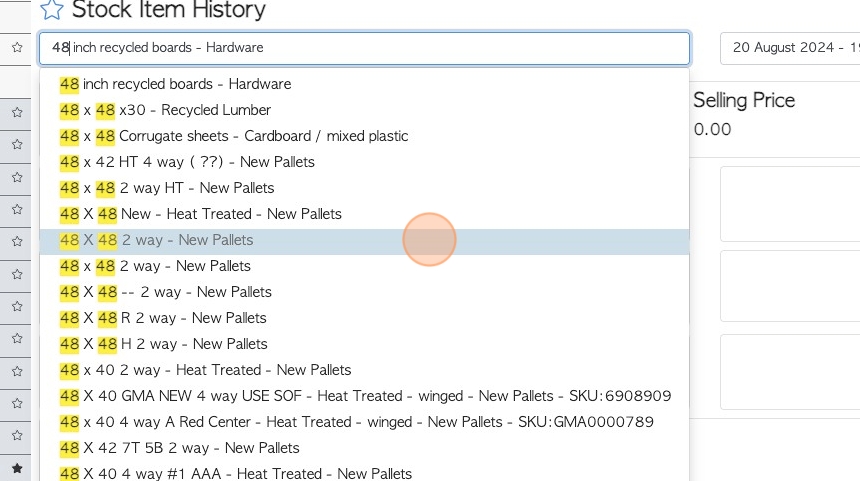
6. TIP! If needed, there is an option to click the "Start Typing To Search Items" field to change the Stock Item History page to a different stock item.
7. Choose the new stock item from the drop down list, and the page will update to the new item's information.
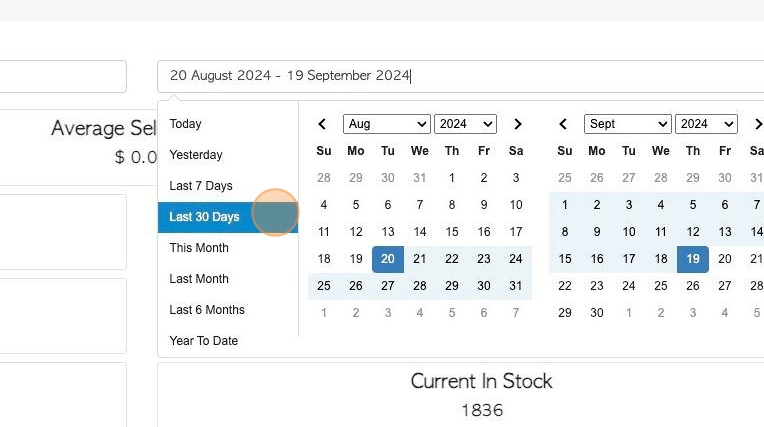
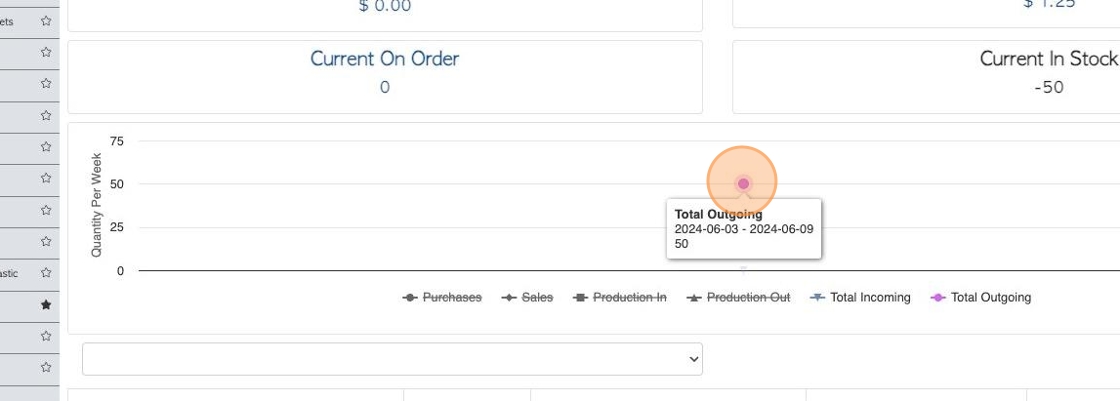
8. Click this text field to change the date range of the report.
Click on a date from the list or choose a date range from the calendar.
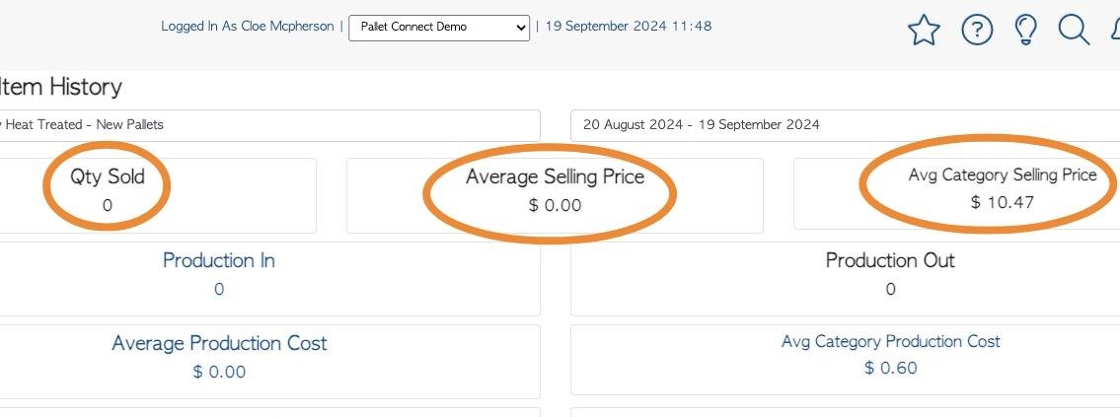
9. The report includes the quantity sold, the average selling price and the average price for the stock category.
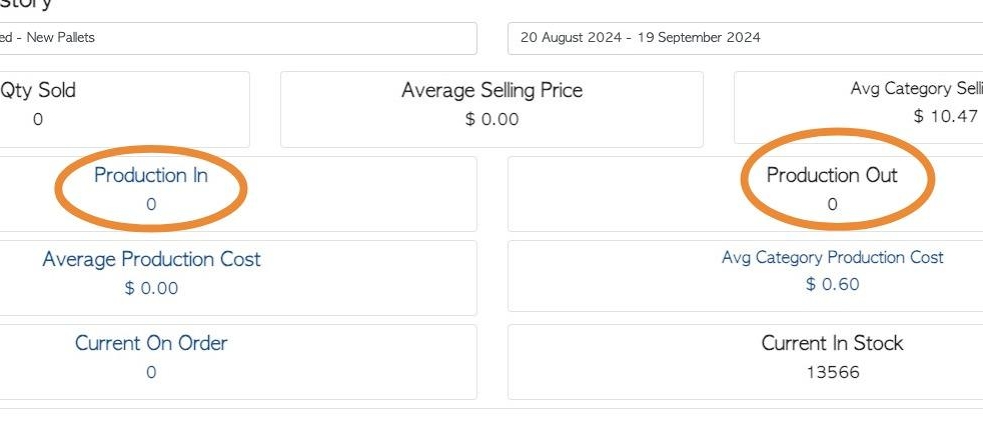
10. Production numbers for the time frame are displayed here.
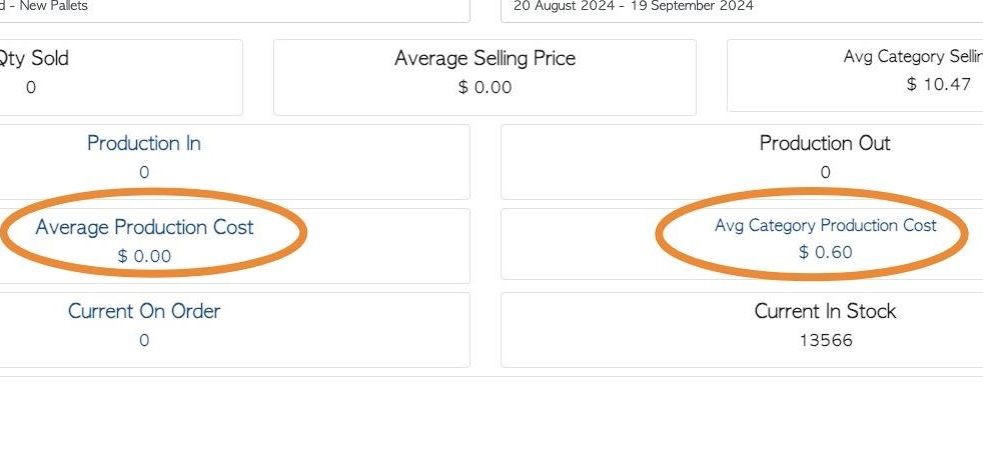
11. Production costs for the time frame are displayed here.
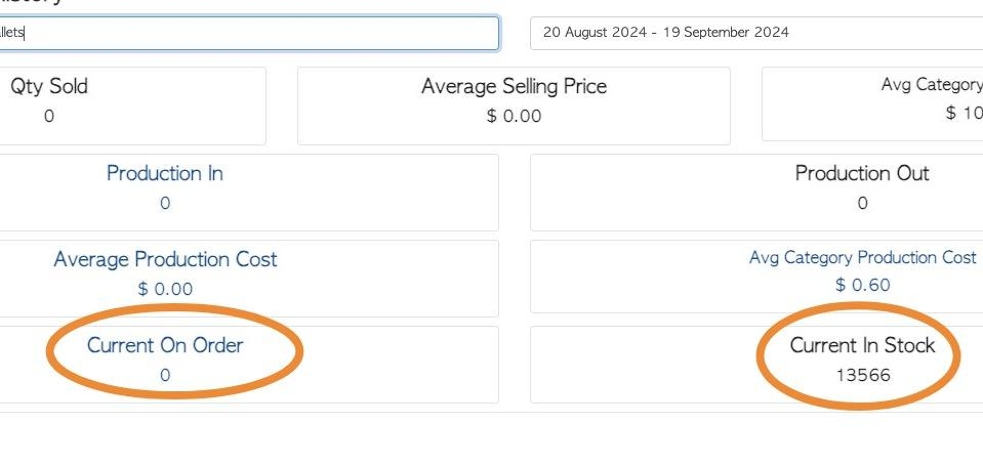
12. Current stock and stock that is on order, are displayed here.
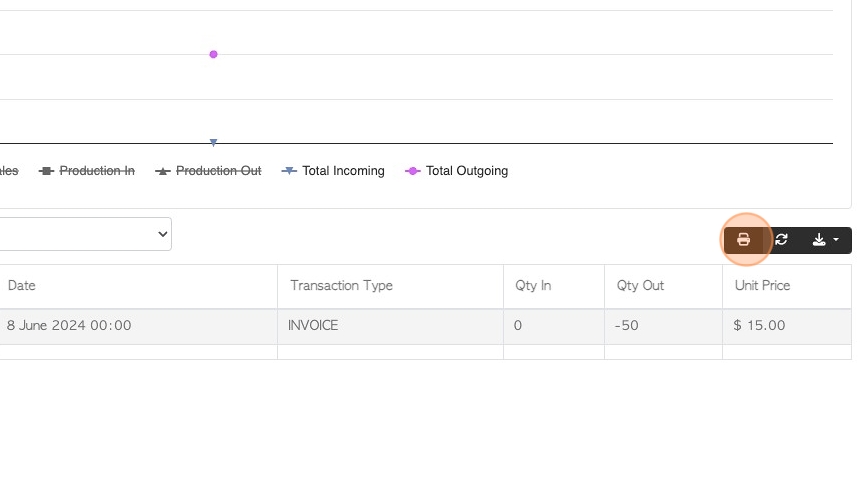
13. The history is also tracked in a graph
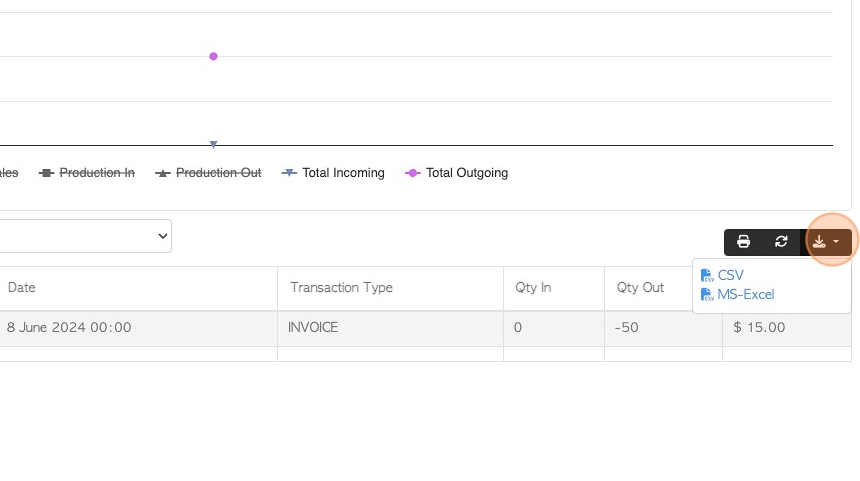
14. The transaction history is displayed at the base of the page.
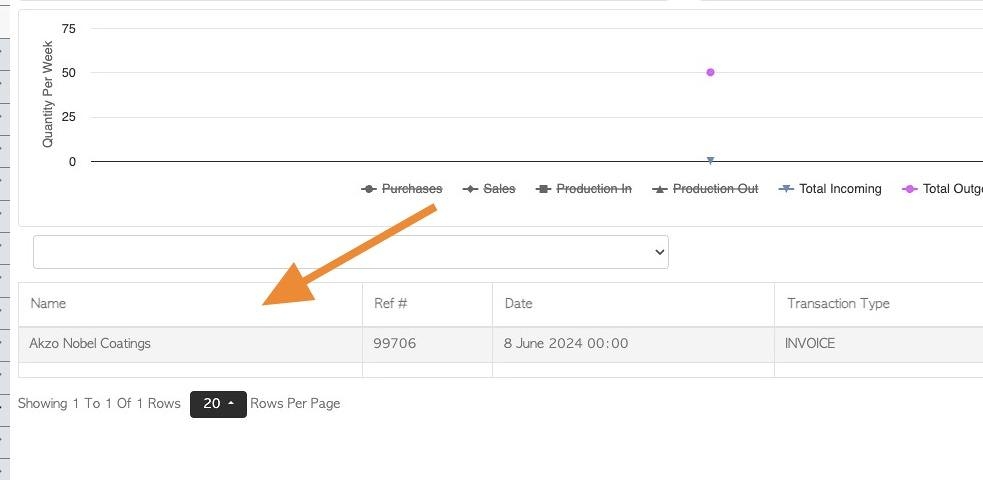
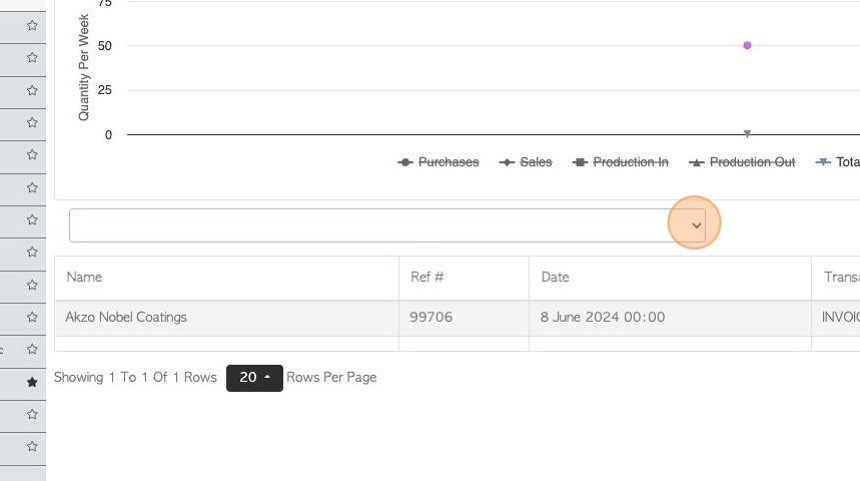
15. Click this dropdown to filter the list by transaction type e.g. production process, sales, purchases.
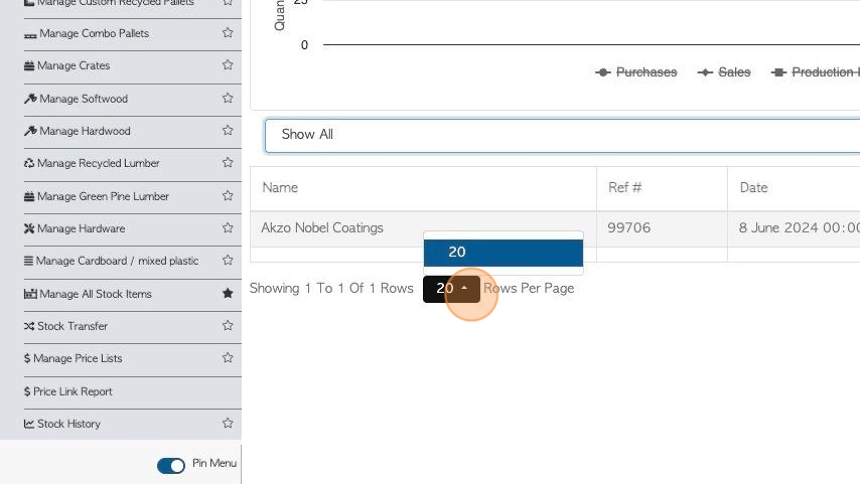
16. Click here to change the rows per page displayed.
17. Click here to print the report.
18. Click this button to download the report.
Choose from CSV or MS-Excel format.